 Give Feedback
How the Kano method works
On this page we'll talk about how the Kano method works, and also how to use our online Kano model tool to put it into action.
How it all started with Noriaki Kano

Professor Noriaki Kano developed the Kano model in the 1980's. He and his colleagues developed a theory that not all features of a product or service would contribute the same amount to the customer's satisfaction - some would have more impact, some less. This led to the proposal of the categories within the Kano framework.
By asking users of the product a specially crafted questionnaire about the features of the product or service, it is possible to categorise each feature and understand how much it is worth investing in improving that feature. And whether it's worth removing that feature entirely, or adding it if it doesn't exist yet.
The challenge with the Kano method is that it's complex and labour intensive to set up the surveys and conduct the analysis. Luckily for you, we've created the world's best Kano survey platform to take all the hard work away! Read on to find out how it works.
There are two major parts...
Part A: publish a survey and collect responses
1. Register an account
First things first, create a free account on our platform to start publishing Kano surveys.
Visit the registration page and enter your work email address and a unique password. No credit card required.
2. Create a survey
Once you've registered and are logged in, you can publish for your first Kano survey. Visit the New Survey page and you'll see the following fields:
Name: this will show in the dashboard so you know which survey is which at a glance. It will also appear at the top of the survey response page, so participants will know what the survey is about.
Description: this is extra information that will appear on the survey response page, so you can give participants extra information and detail about your product and why you're doing this survey. The more context they have about things, the higher quality their answers will be.
Language: choose the language that your survey will be in. This will set the display language of the platform for respondents, so they can see everything in their own language.
Feature ordering: if you want to randomise the order of the features in the survey, check this box. This is useful to avoid bias in the results, as participants may be influenced by the order in which they see the features.
Step-By-Step: if you want to show one feature at a time, check this box. This is useful for long surveys, as it breaks the survey into smaller chunks and makes it easier for participants to complete.
Success URL: enter a URL to redirect participants to after they've successfully completed your survey. This could be a thank you page on your site, a blog article, a product sales page, whatever you like. If you leave this blank then participants will get a standard thank you page on our platform.
Completion message: if you want to use the standard success page, you can show a custom message on that page if you need to give the participant some follow on instructions or just want to say thanks in an authentic way.
Logo and colours: style the survey form to match your brand.
-
Custom fields: create custom questions to collect additional information from your participants, for example name, email address, demographic information or whatever else you need. You can choose between a plain text field, a 'single choice' where the participant can select a single predefined answer, or a 'multiple choice' question where they can select many predefined answers.
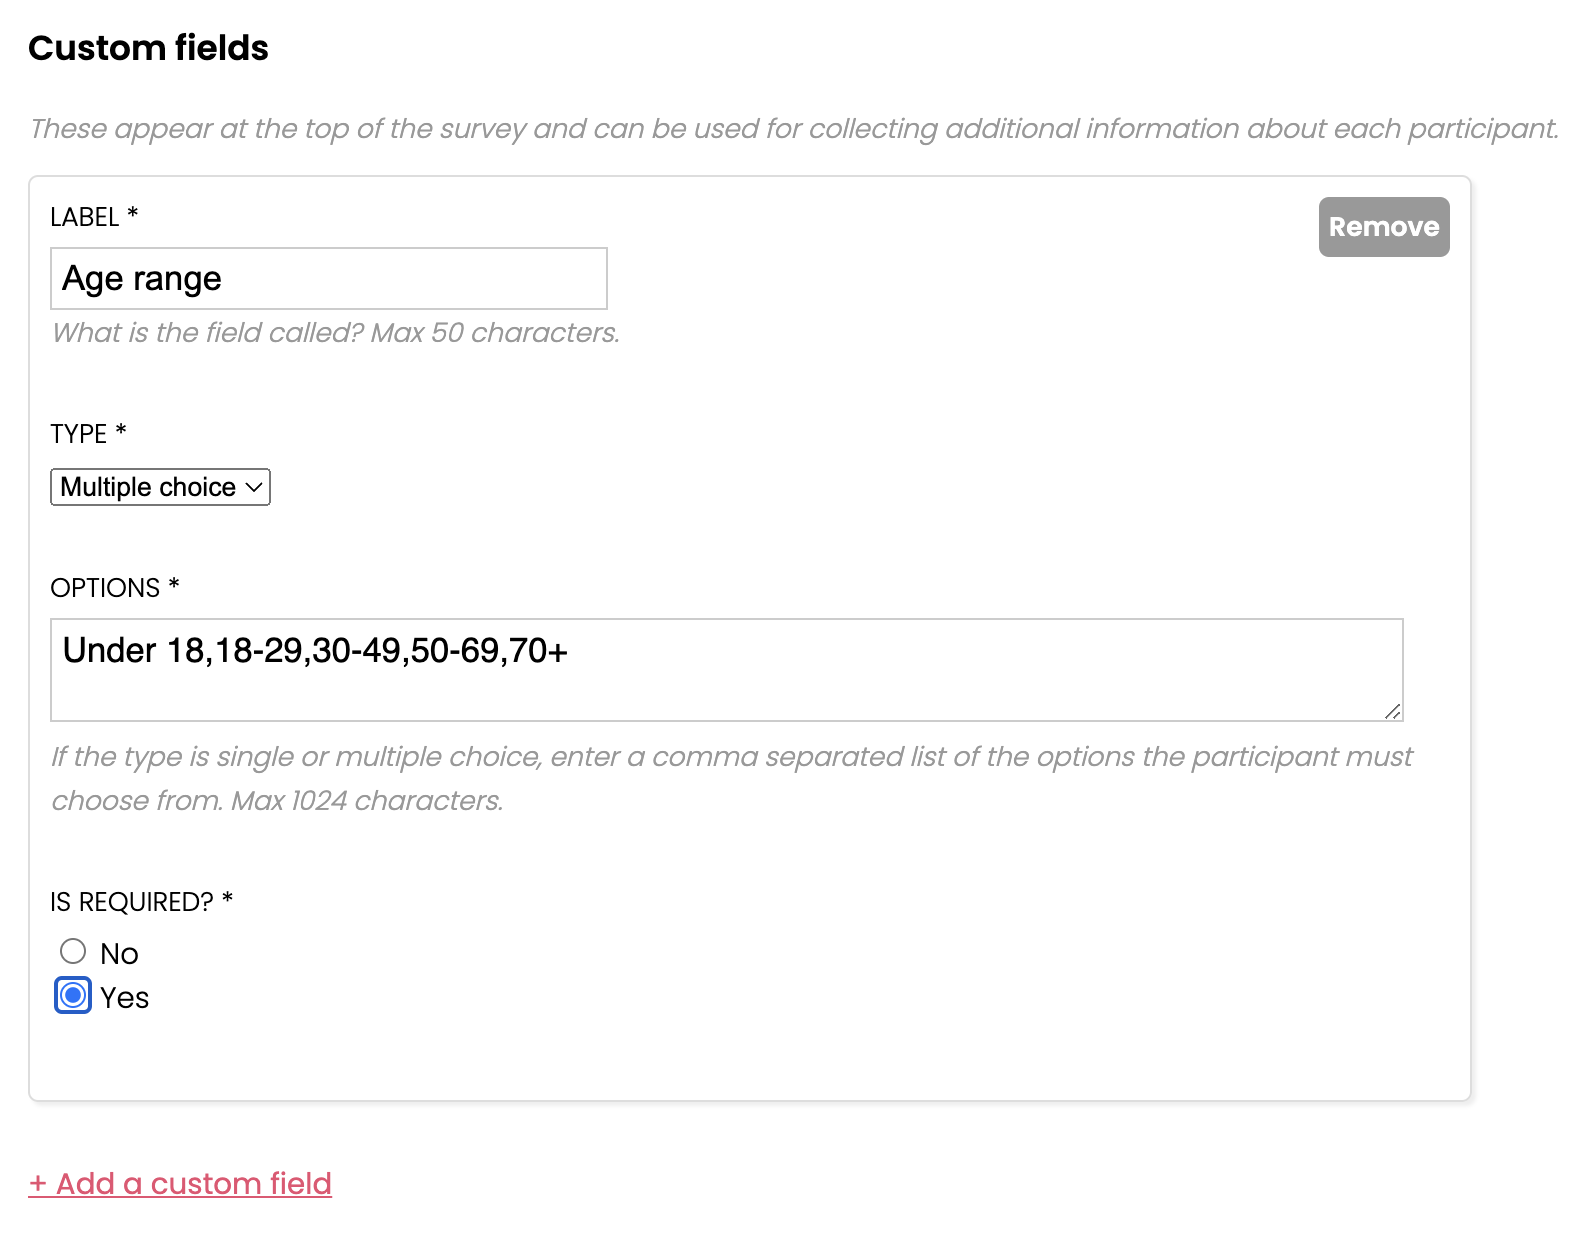
-
Features: for each feature you want to test, describe what the feature is or what it does. Here's a few examples for a music streaming app:
- Search for songs by artist, song title or album
- See related songs that are from the same genre
- Save songs to a playlist that I can find again later
- Share my playlist with my friends through the iOS default share action
- etc
The clearer you can make the feature descriptions, the better participants will understand and the better the signals you'll get in the survey anaylsis. For each feature you can also add an image to help describe it.
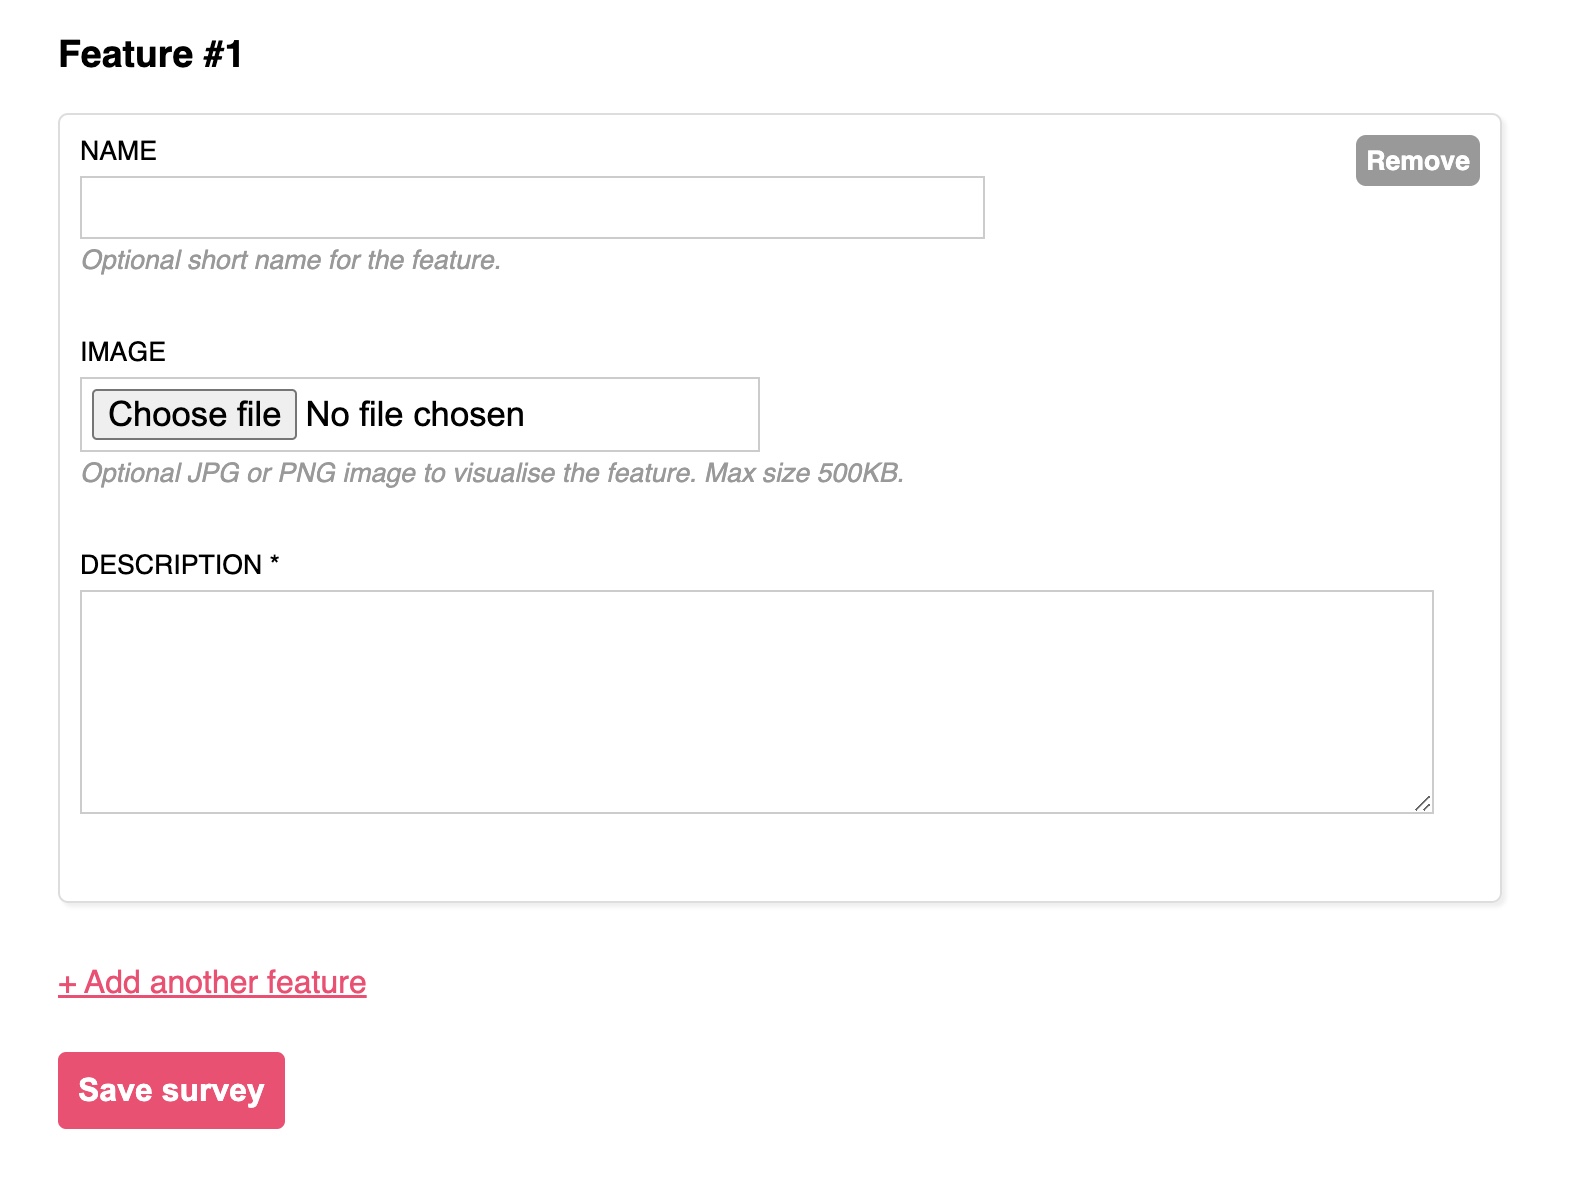
Press "Save" and that's it, your survey is created and you'll be sent back to the Dashboard.
3. Activate the survey
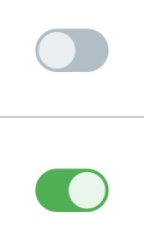
Click the toggle next to the survey to activate it so it is live to the public and can receive responses.
If you don't do this, people won't be able to fill in the survey. Any time you want to stop receiving responses, you can just click the toggle again to take it offline.
4. Share the link
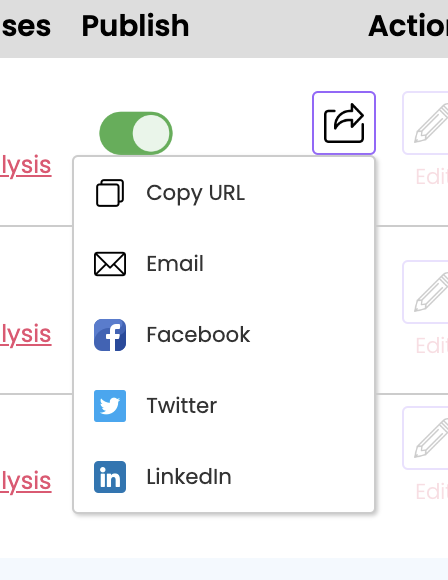
Click the Share icon next to the survey to open the share menu. Then choose the option that works for you and share the survey with your participants however suits you best. Copying the URL allows you to send it via other channels too, eg. Slack or Teams.
Share it with people that are targeted to your industry, product or even particular features. You want to make sure you're selecting participants that are representative of your overall user base or target audience, that way the results will be reliable and relevant to you.
The more people you share it with, the more responses you'll get, and the more reliable your results will be.
You can test the survey yourself.
5(a). Wait for the responses to come in
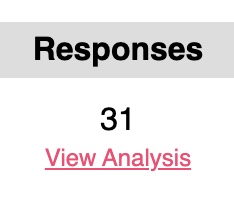
As responses come in you'll see the counter going up in real time.
Once a survey has responses, you can no longer edit the survey as this would spoil the integrity of the results, since some participants might be responding to different descriptions or even different features entirely.
5(b). Or, Import responses
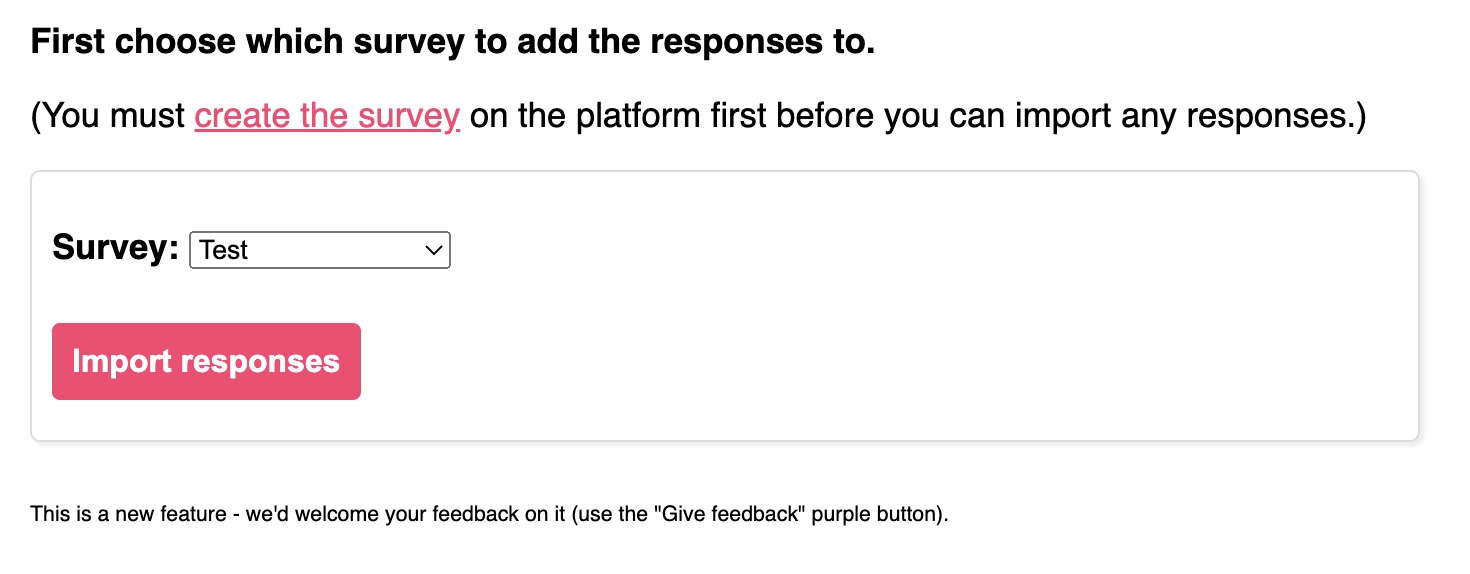
If you've already got some responses that you collected through another survey platform, or even if you collected them manually offline somewhere, as long as they match the Kano framework format you can put those responses into a spreadsheet and upload them to the platform.
Use the import wizard to guide you through the process.
Part B: analyse the results and act on the insight
Finally, you get to see your results! Click the "View analysis" link underneath the response counter.
The Kano method analysis is performed in real-time, so every time you get a new response you can view the results again to see how things have changed. Learn more about Kano analysis example.
1. Discrete analysis
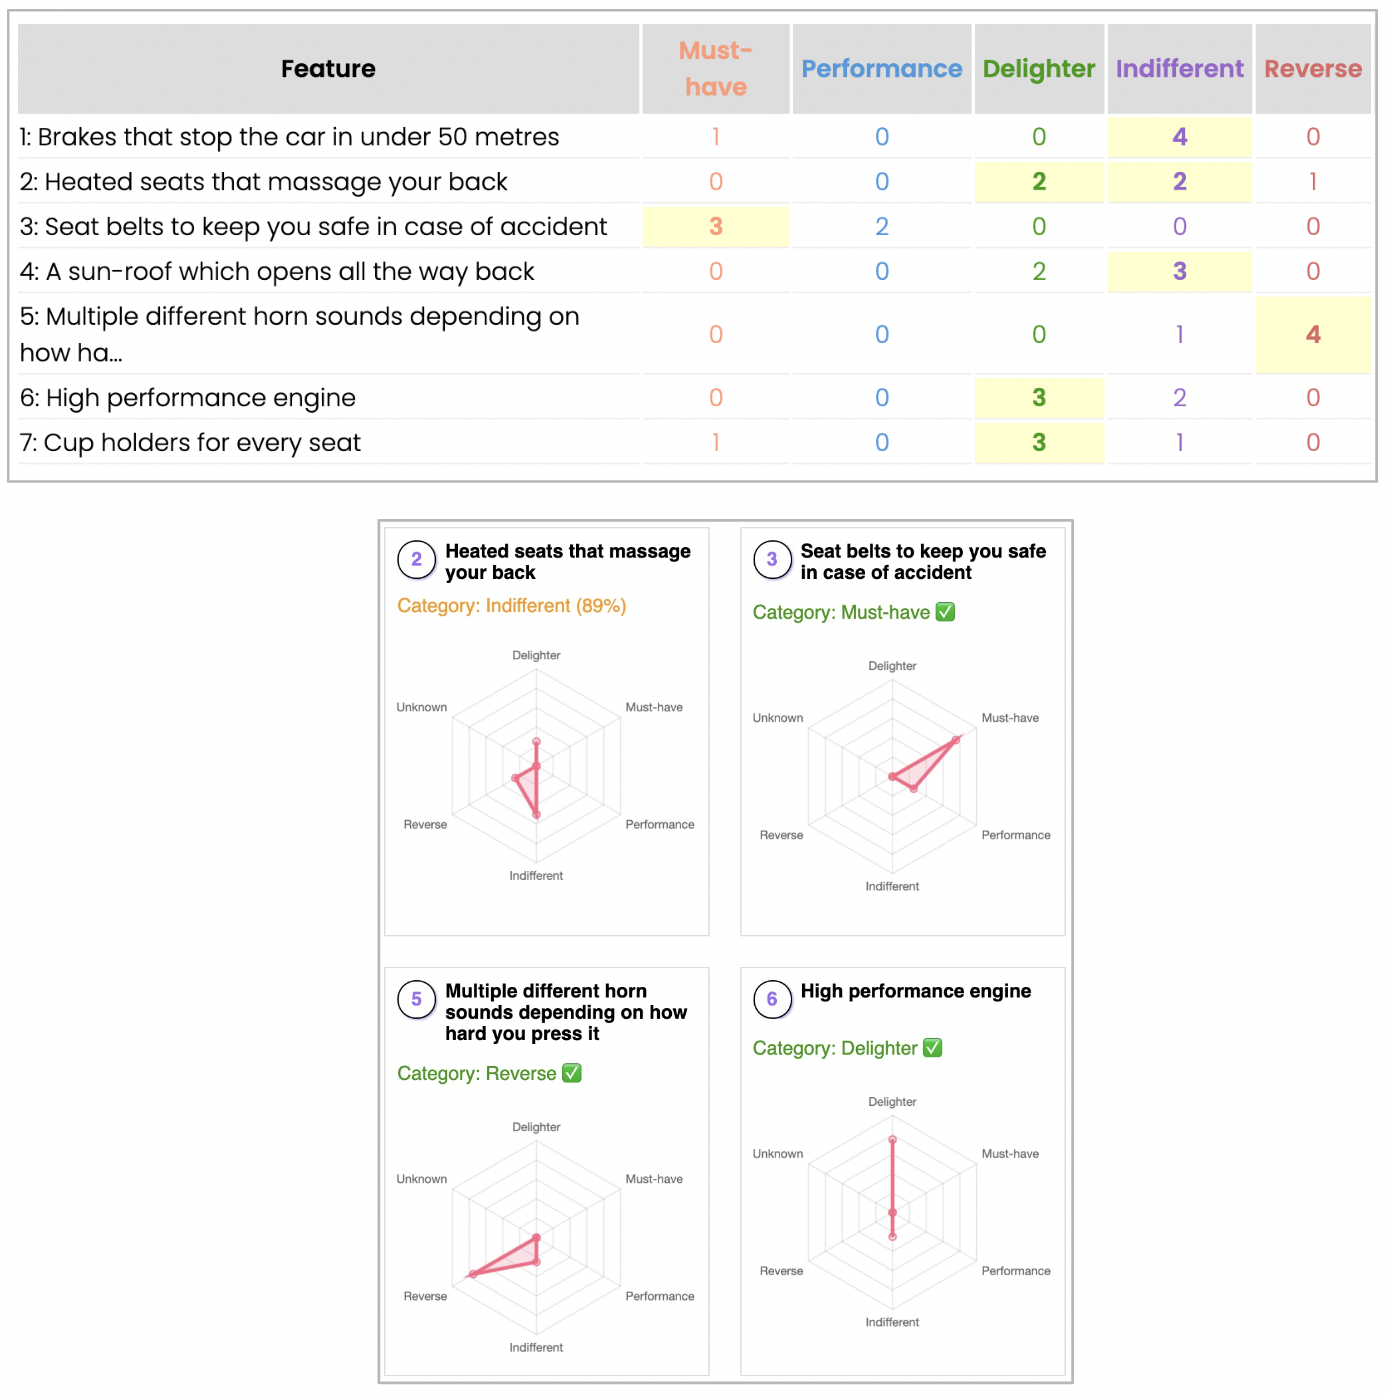
Each feature is analysed separately and displayed in a table. For each feature you get two pieces of insight:
-
The Kano category: where we can detect a single category that is significantly ahead of the others, you'll see a green category name with a tick. This indicates we're confident that the category is accurate. That doesn't mean it won't change it you get more results, just that it's the clear winner so far.
If we can't detect a single category, you'll see potentially multiple categories in orange with a confidence percentage next to them. That confidence shows how close they are to being the significant winner. This is helpful to see how strong the signals are, even if they're not completely significant yet.
-
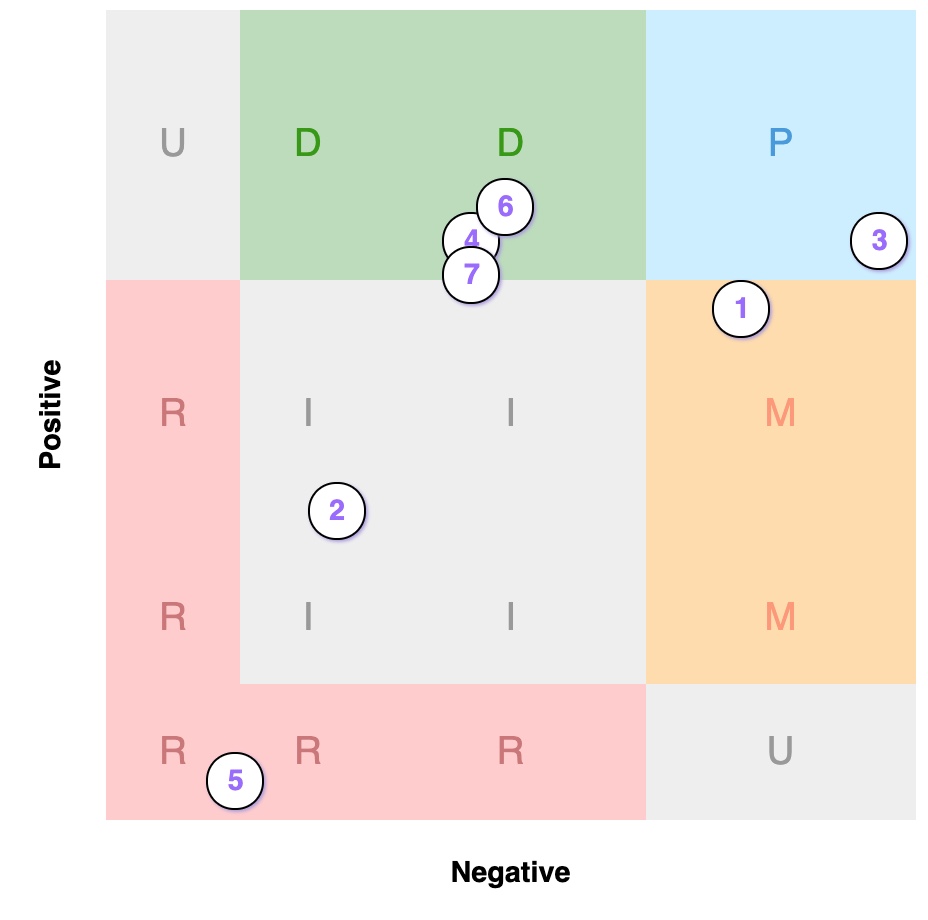
The radar chart: each response is categorised individually, and this graph shows the distribution of response categories for each feature. It shows you visually how the 'votes' were spread amongst the different categories and can reveal if there's a split decision, or a sub-group with a strong view in another category, or even if you just got a mix of confusing answers.
2. Continuous analysis
While the classic discrete categorisation is the original time-honoured technique developed by Noriaki Kano and colleagues, others (like DuMouchel) have built on and improved that in the years since.
The continuous analysis offers a more nuanced approach that takes into account all the responses, rather than just the most common as with the discrete analysis.
3. Satisfaction potential
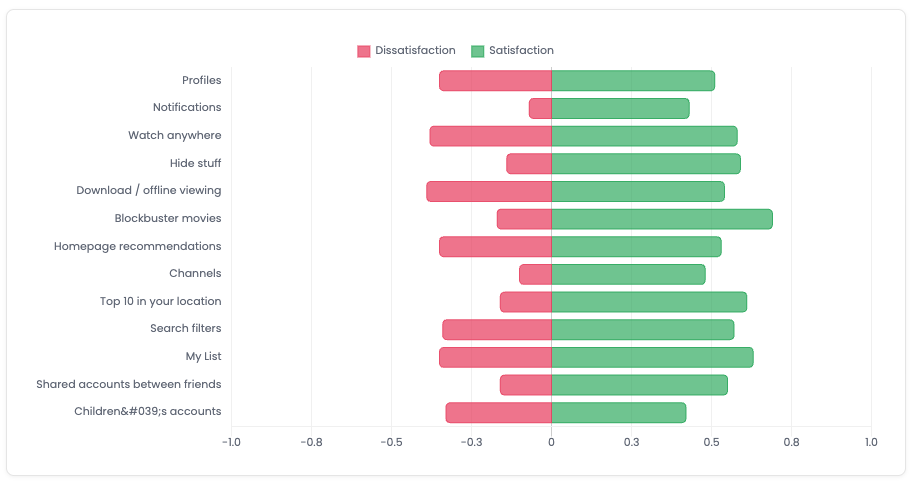
Another improvement on the original (by Timko), this third type of analysis offers a look deeper than just the Kano category itself; here you get insight into how impactful the category is, either positively or negatively, on customer satisfaction. So you can compare all the Delighters side-by-side and see which is the most delightful.
4. Prioritisation
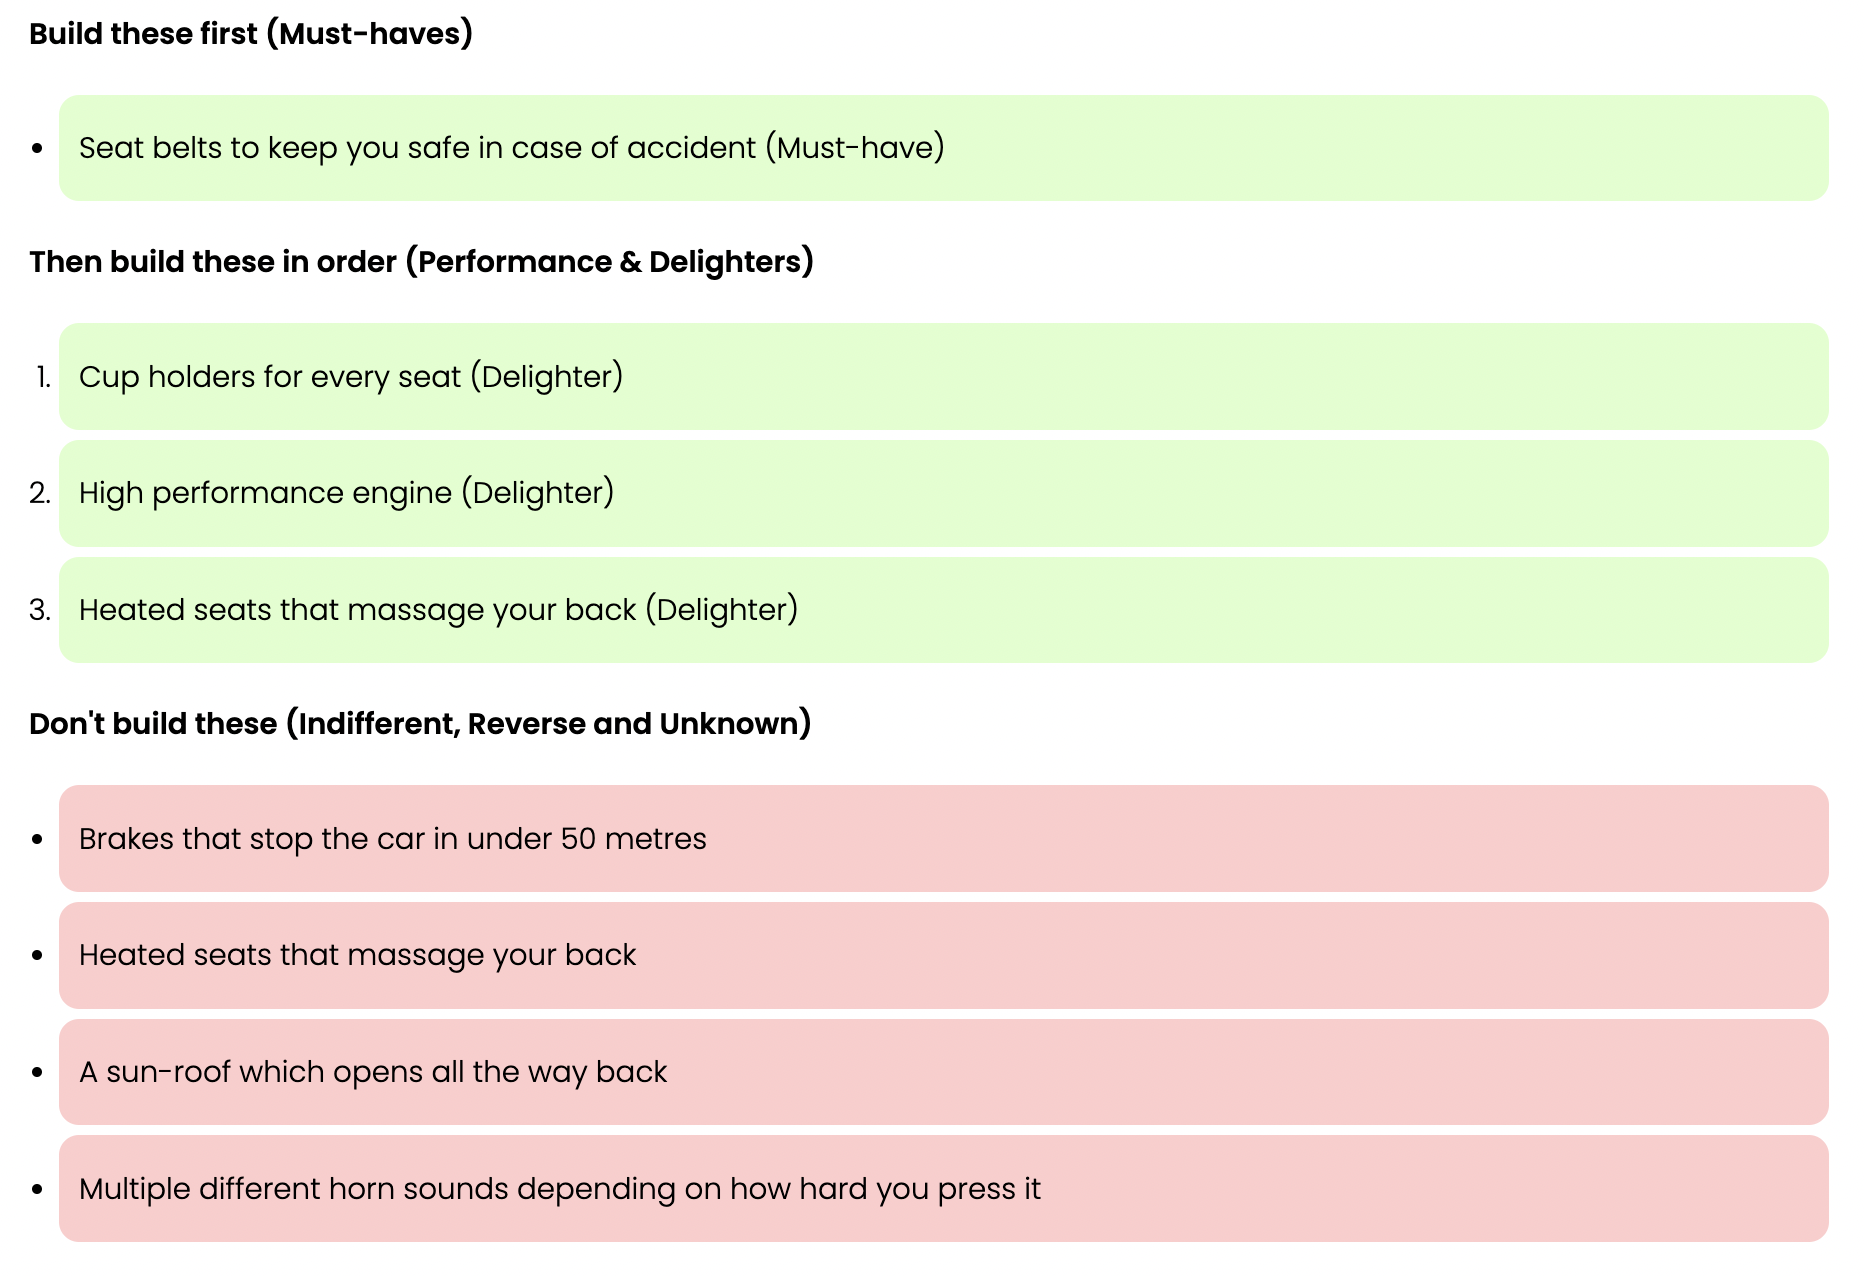
Lastly we combine all of the above insight and put the data into action to produce a prioritised list.
This list is ordered to achieve the biggest improvement in customer satisfaction, by maximising positive impact and minimising negative impact.
This takes all the guesswork out of the Kano method, and means that you can go straight into building, confident that you're doing it in the right order.
For more info on interpreting the results, see feature prioritisation.
That's a wrap!
Hopefully that's given you a good overview of how to set up and run a Kano framework survey, and how to analyse Kano survey results.
Create a free account now and you can have your first survey running in just 2 minutes time:
Publish your first Kano survey
