 Give Feedback
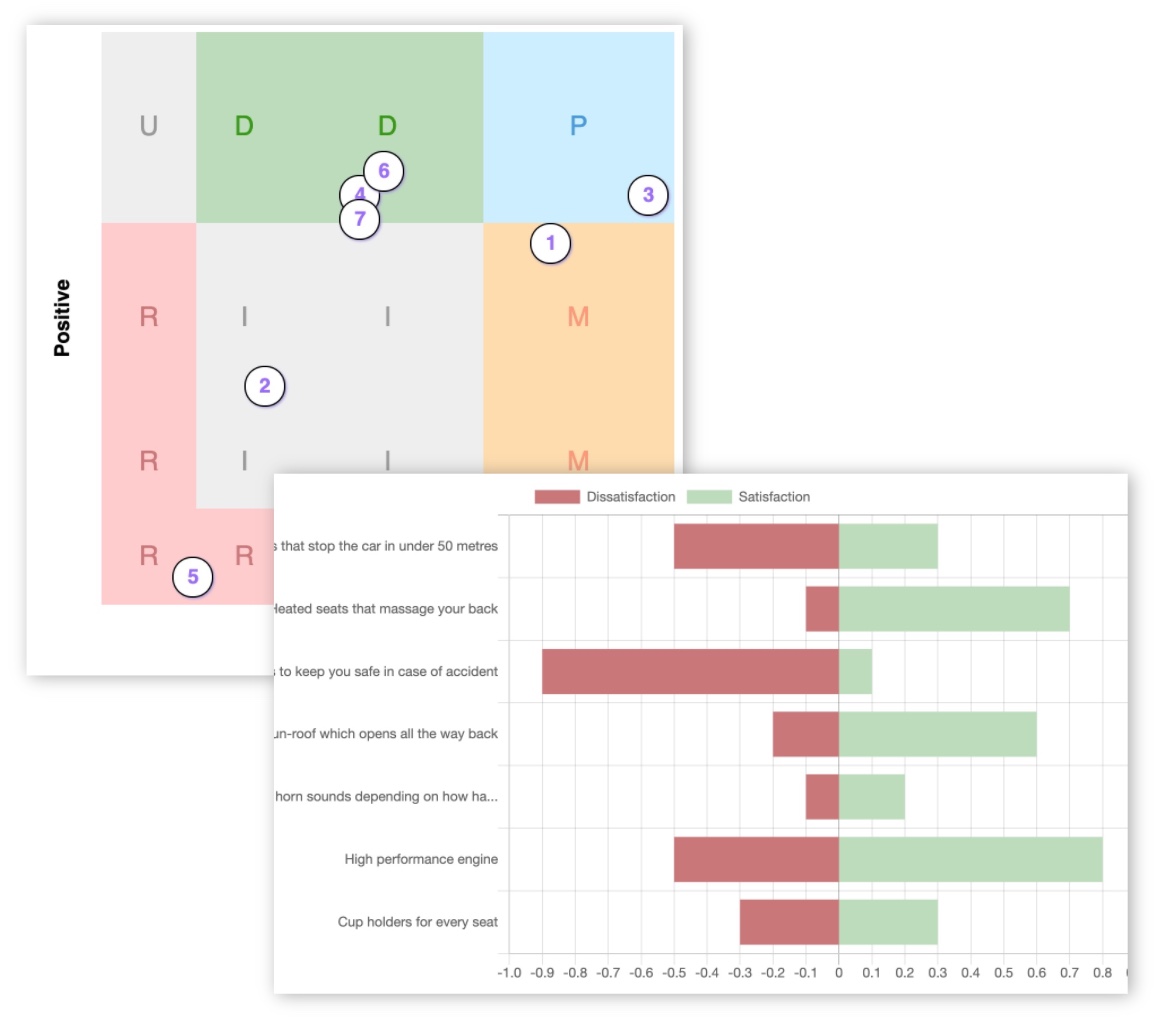
Free Kano Model Template (Google or Excel)
Download the free Kano model template
If you're planning to running a Kano model survey, you may be thinking - "how do I actually analyse the results?"
Maybe you're thinking of using a spreadsheet like Excel or Google Sheets, so you're looking for a Kano template you can use.
The good news → it's definitely possible.
The bad news → it's not that easy.
The trouble is that everyone's result data is in a different shape so it's hard to fit it into a standard template. If you need to make any changes to the Kano model template (which you probably will need to) then you need a good understanding of spreadsheet functions like INDEX, MATCH, VLOOKUP and so on.
Then you have to copy and paste your data into the sheet in exactly the right format (and hope that you don't make any mistakes while you do it!), and as new results come in you have to do more copy/pasting to update the analysis.
And in the end the analysis tends to be very basic because of the limitations of spreadsheets for this sort of task.
Basically...
It's much better to use a tool like KanoSurveys.com to run your survey instead of Excel. You can create an account in 10 seconds, publish your first survey in minutes, and the analysis is fully automated in real-time. Get started for free.
With that said, below I will show you how to set up a simple Kano analysis template to do the categorisation for you. This should help you better understand how the Kano technique actually works, and should be enough for simple projects or demonstrations.
If you want to see how this applies in the real world, check out this example Kano survey analysis.
The screenshots show Google Sheets but you could use Microsoft Excel, OpenOffice, Apple Numbers or any other spreadsheet tool you prefer.
Step 1 - create a blank sheet
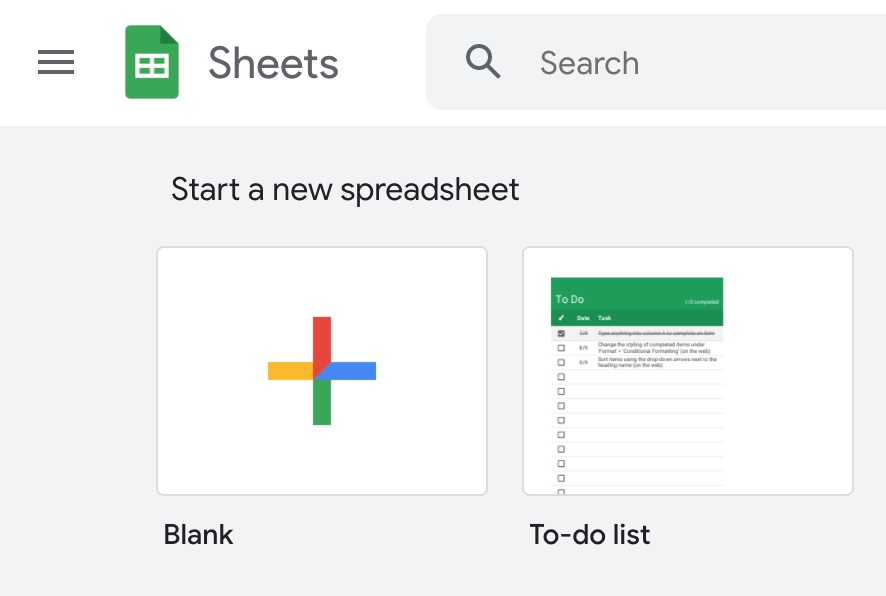
Create a new sheet, and add three tabs - "Categories", "Data", and "Analysis".
Step 2 - the categorisation table
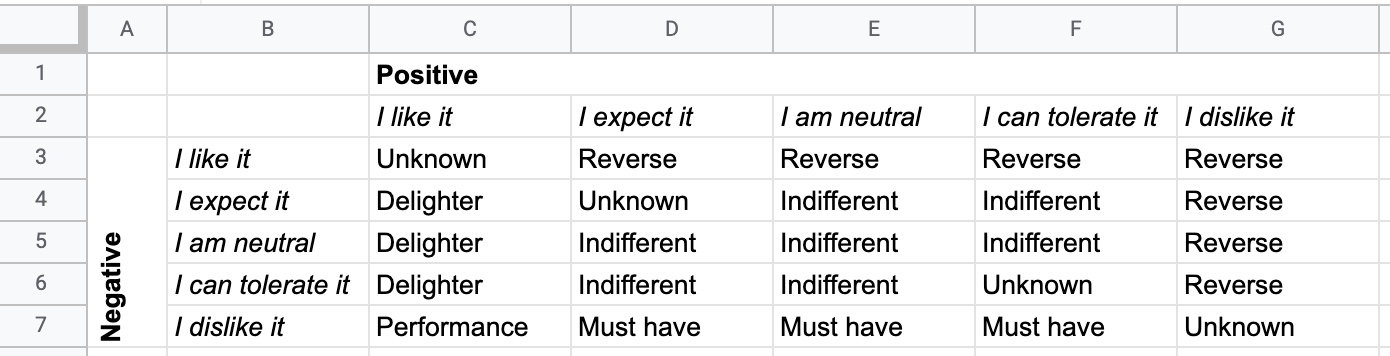
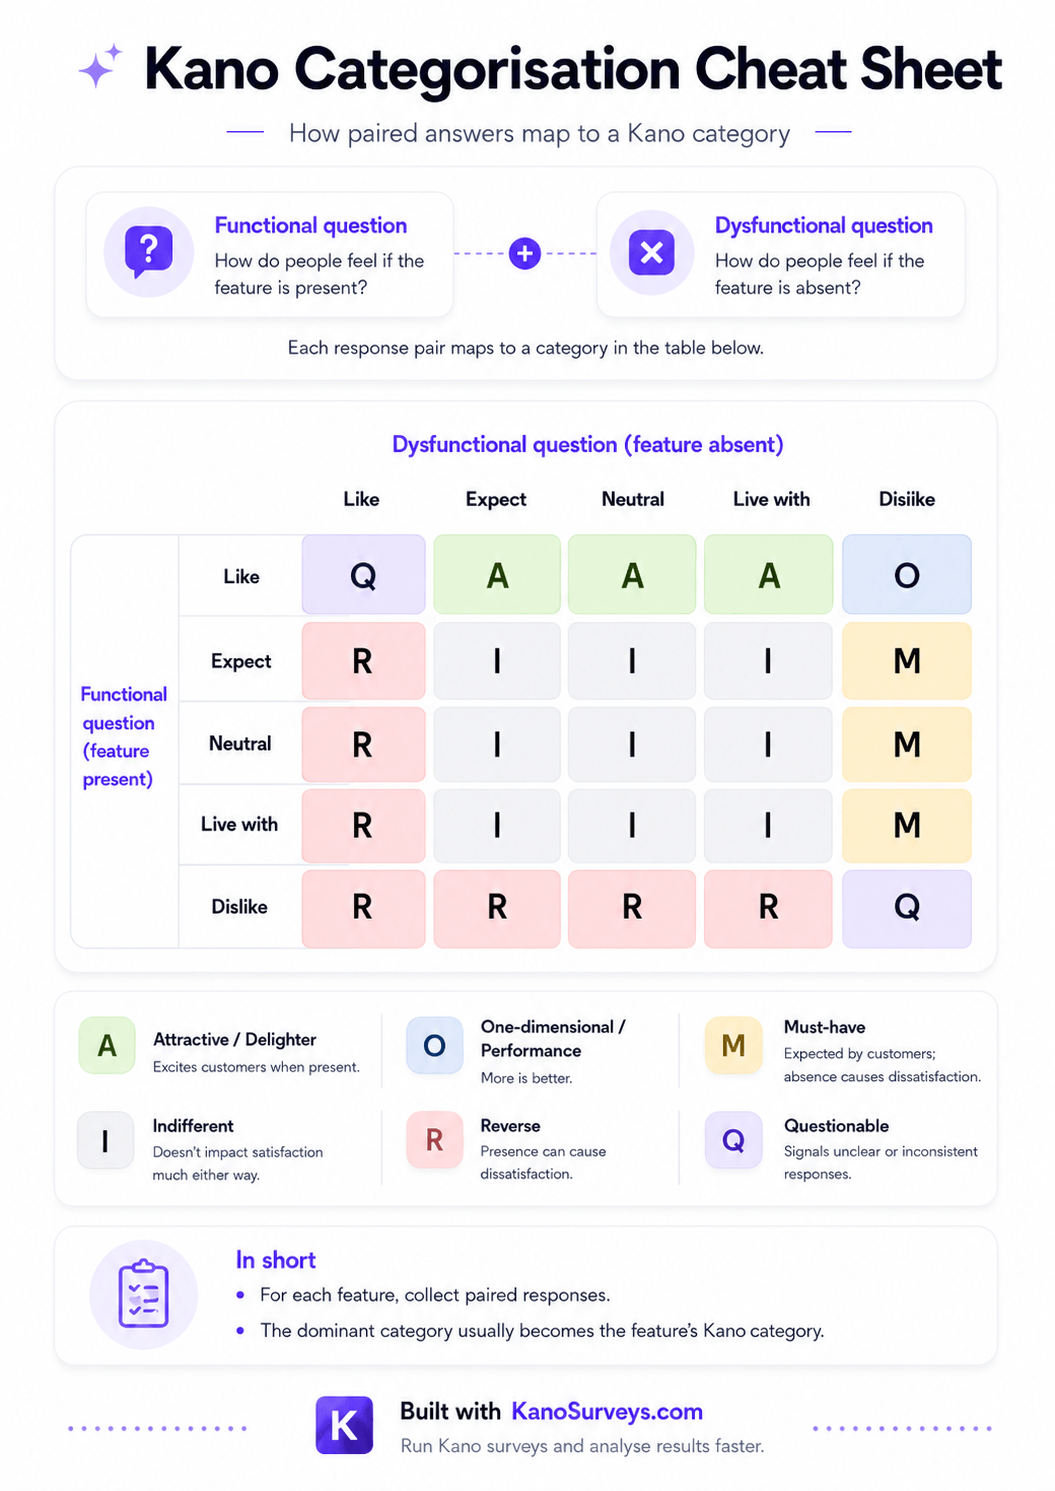
In the "Categories" tab, create a table like this that matches pairs of positive and negative answers together to give a category. There are several different versions of this table, with different people taking slightly different interpretations. You're free to make adjustments to suit your own interpretations of course!
Have a play with our interactive Kano categories tool to get a good understanding of the mappings.
Or use this helpful cheatsheet to remember how the Kano categories evaluation chart works:
Step 3 - copy/paste the results
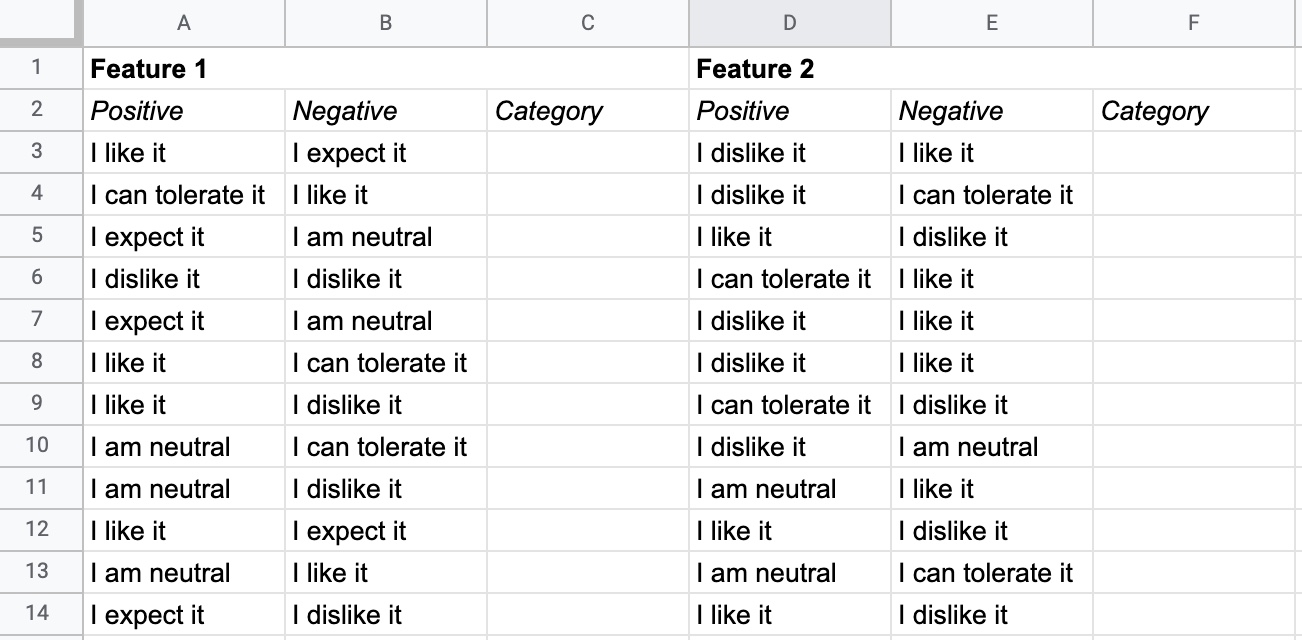
Next in the "Data" tab enter your results. These are the pairs of positive and negative answers that you received from your survey respondents, grouped by feature. Add more groups of columns going across for each feature you tested. Leave one column blank per group - we'll add a formula to that next.
Step 4 - categorise the responses
We need to fill in the empty "Category" columns now. We're going to use the INDEX and MATCH functions to find the right entry in the category table.
The INDEX and MATCH functions work the same in both Google Sheets and Excel.
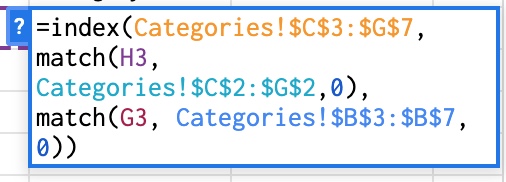
Mine looks like this:
=index(Categories!$C$3:$G$7, match(B3, Categories!$C$2:$G$2, 0), match(A3, Categories!$B$3:$B$7, 0))
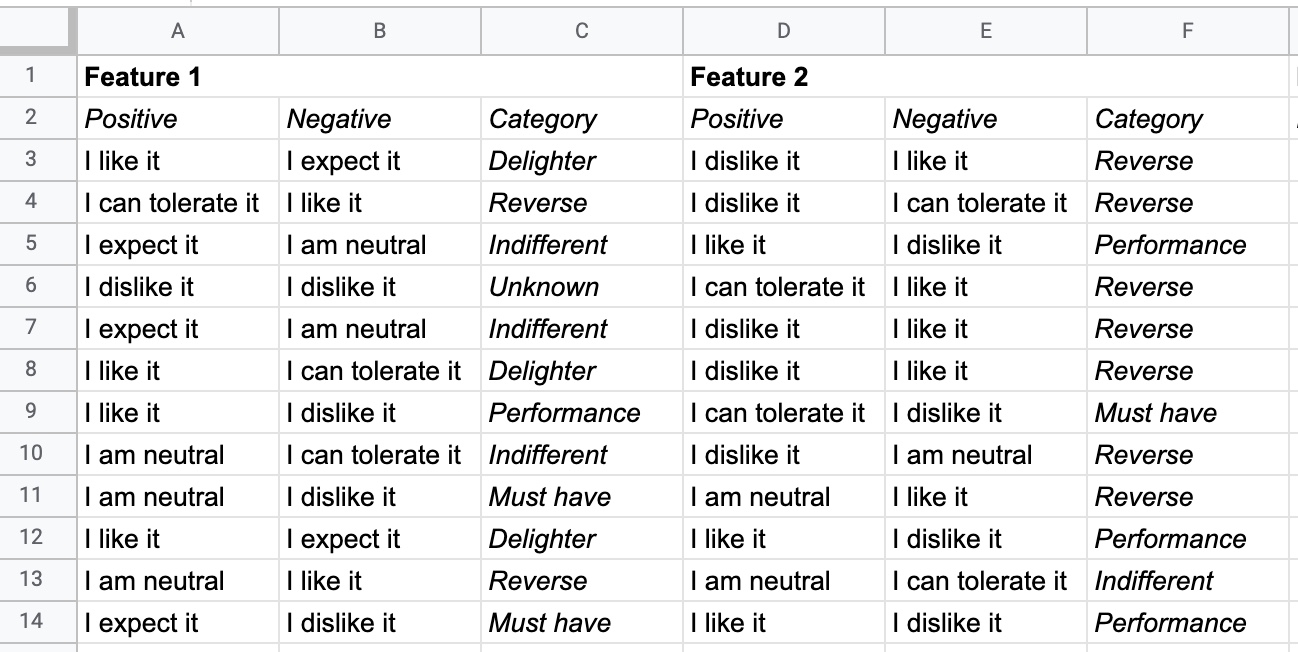
Copy and paste this into cell C3, then click and drag the formula down the category column. This will automatically update A3 and B3 to match the row for that feature group. A3 is the positive answer column, B3 is the negative answer column.
Repeat the copy / paste & drag down for each feature, in the Category column for that feature.
Now each feature in each response will have a Kano category against it. Well done!
Step 5 - count the categories
We want to find the primary category for each feature. This is the most basic way of doing Kano analysis. We do this by counting the categories for each response that we calculated in step 4, and whichever category appears the most becomes the primary category.
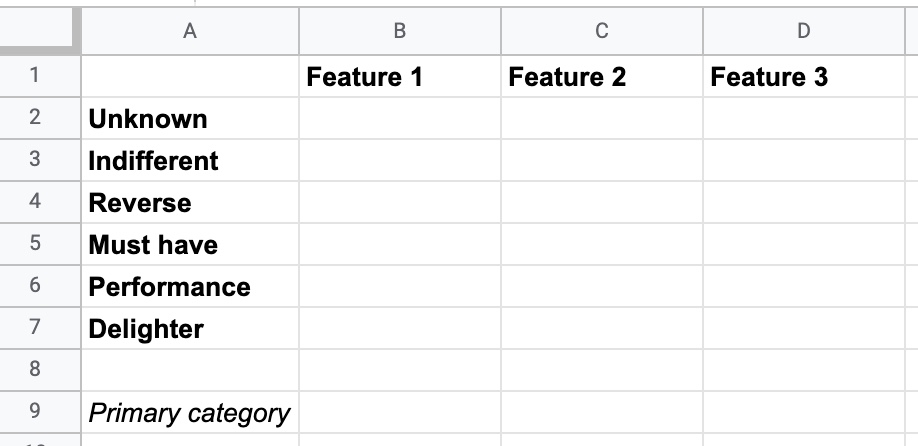
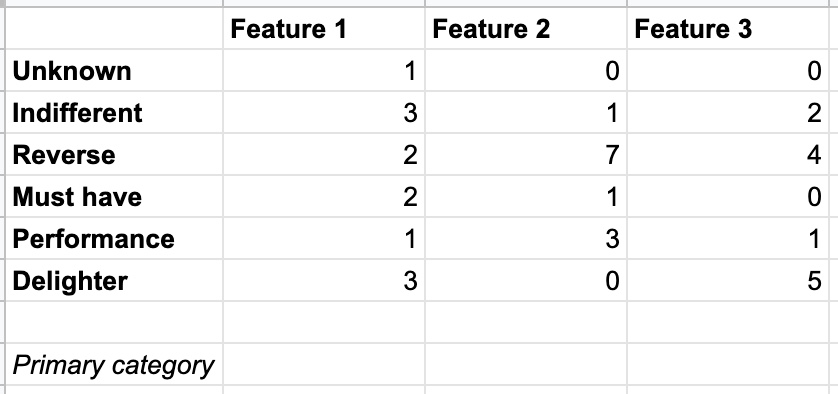
In the "Analysis" tab, create a table as in the screenshot above with features across the top and categories down the side. The bottom row will hold the primary category - the one that comes up the most in the responses.
Now we need another formula. Enter this formula into all the boxes in the table:
=countif(Data!$C:$C, A2)
Change $C:$C to match the column with the categories for that feature, from the "Data" tab. So column C is feature 1, column F is feature 2, column I is feature 3 and so on.
A2 refers to the name of the category, so that should match the row that you're counting - A2, A3, A4 etc.
You should get a table like this:
Step 6 - find the primary category
Last step of building the Kano analysis template!
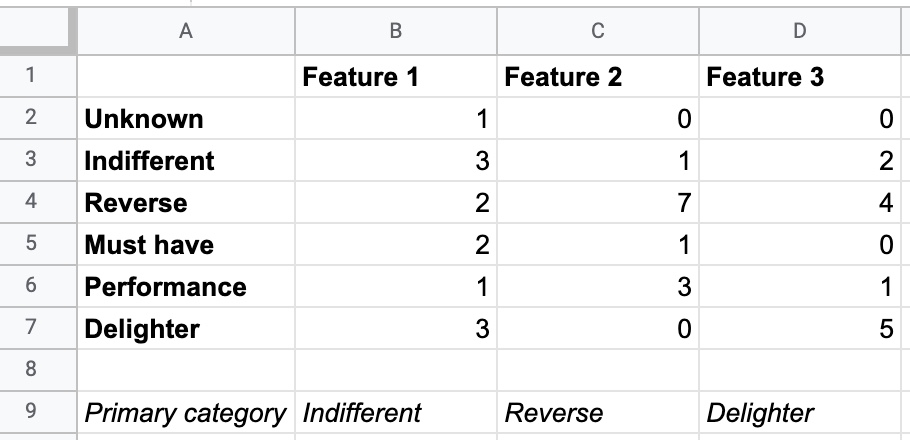
Finally we can find the primary category for each feature. Enter the formula below into the bottom row of each feature, adjusting the D to match the column you're entering it into. This will find the highest value in that column and then look up the name of that category.
=index($A$2:$A$7, match(max(D2:D7),D2:D7,0), 1)
And there it is, the final answer - the primary Kano category for each feature.
Kano analysis template Download (free)
If you've followed along, you now have your own simple Kano model spreadsheet (Google sheets or Excel or whatever you used). But just in case you want a ready-made free Kano model template, you can download it below.
Here's my version so you can see a working example, or make a copy to tweak for yourself. Open the link, then click on File -> Download -> Choose your format.
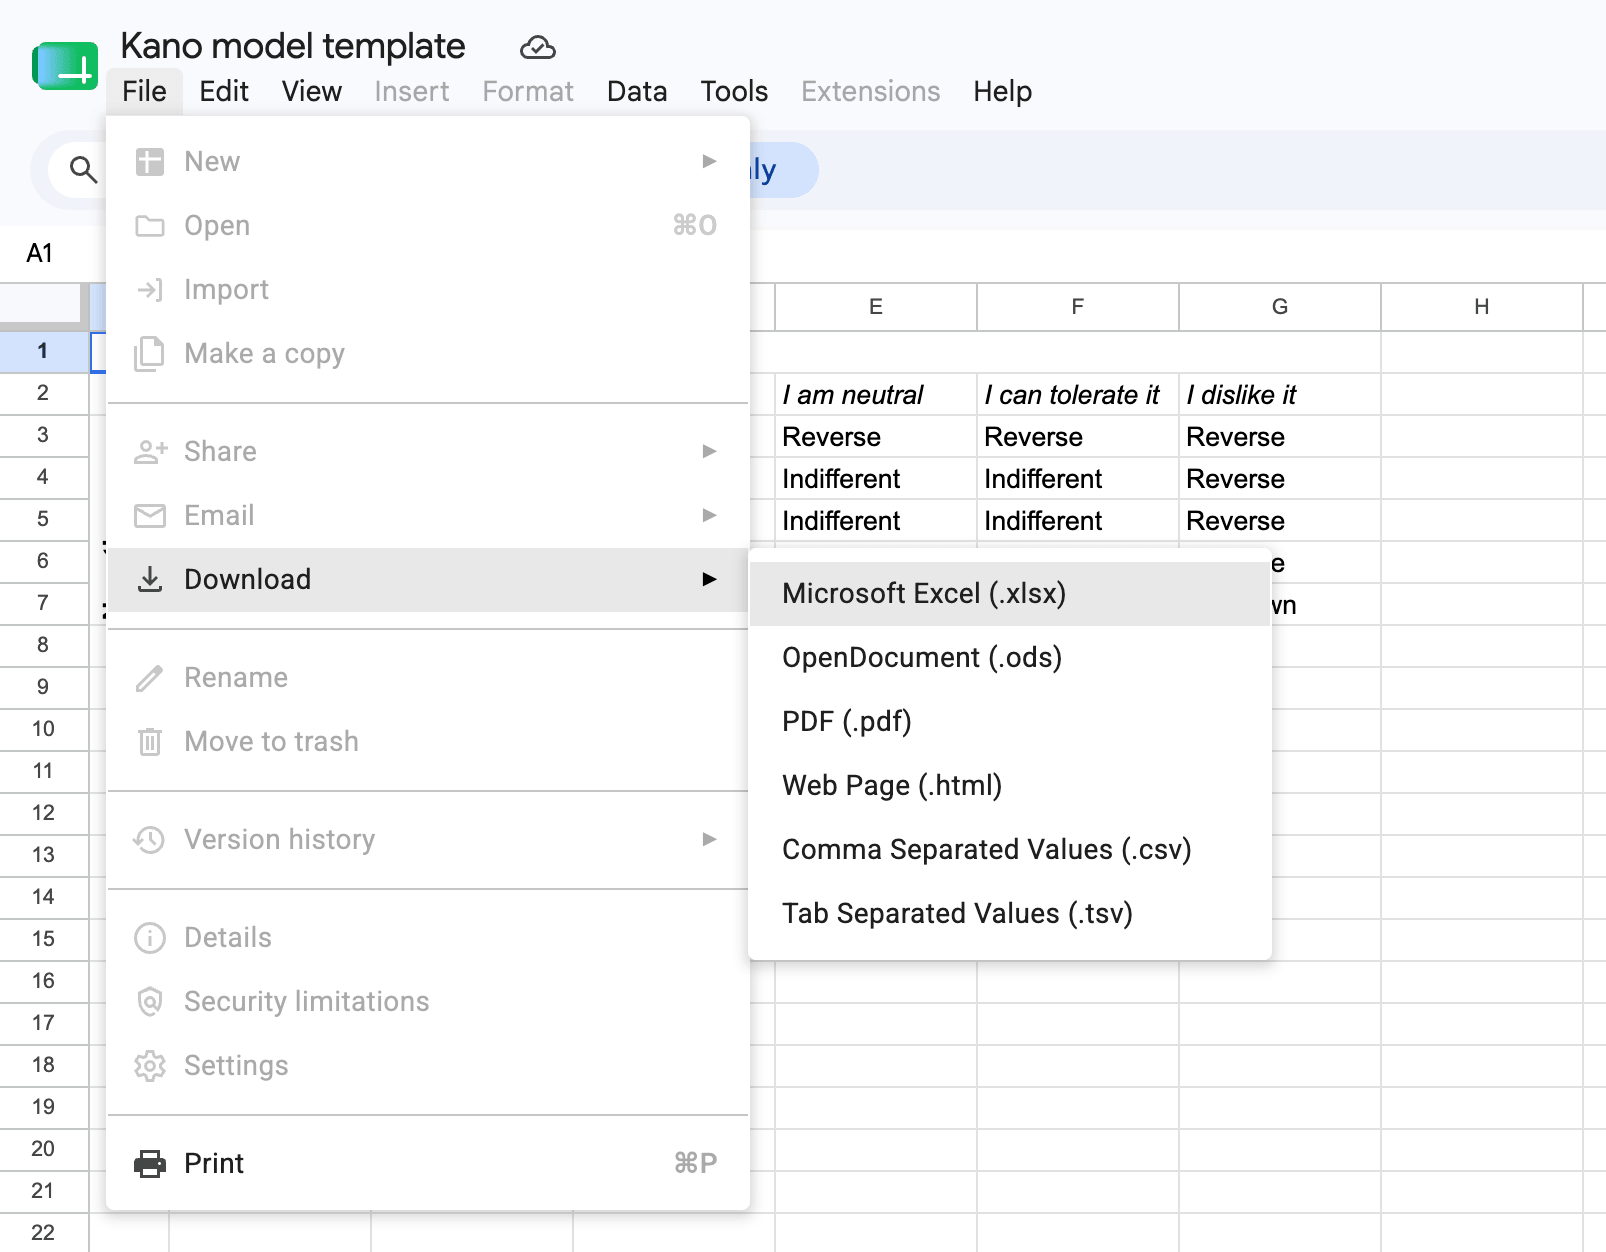
Or if you're signed-in to Google Sheets, you can copy the sheet as a "template" which is a bit faster.
But it took a lot of fiddling to set up, some coding knowledge and the analysis is pretty basic.
Having just a single primary category isn't quite the full picture. Sometimes you'll get a split decision between two primary categories, sometimes you'll get a winner but only by a tiny margin, or sometimes you'll get results where there's no clear winner at all!
Our Kano analysis tool solves all these problems and gives you much more insight into your results. Get real-time analysis, multiple different analysis techniques, a dedicated survey tool and much more.
KanoSurveys.com is a specialist platform for running Kano model surveys, which takes all the hassle out of it.
Register now and get started straight away
