 Give Feedback
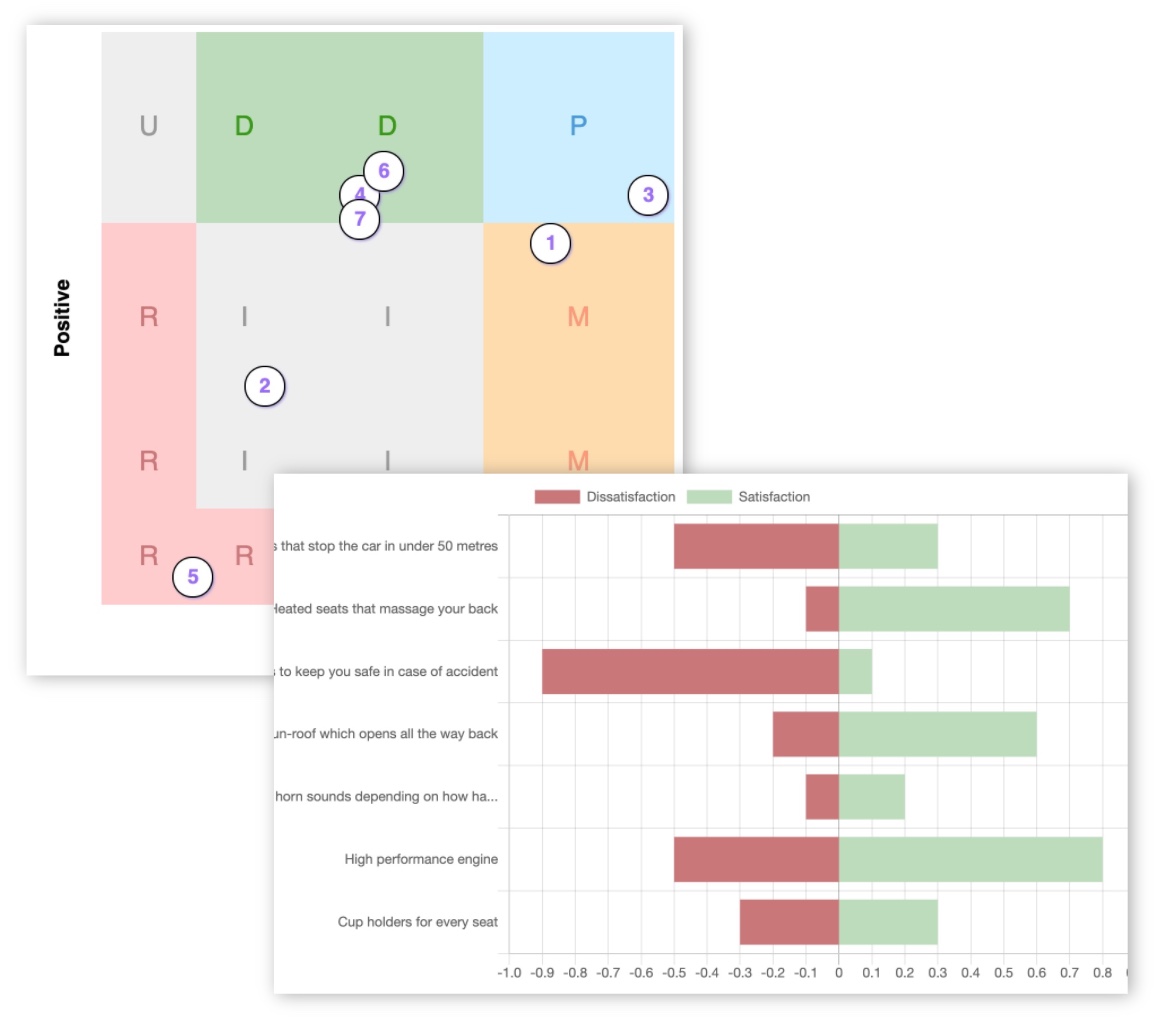
Kano Model prioritisation in Product Management

What are the best ways to prioritise your backlog?
This is the ultimate question for product managers, startup founders, indie hackers, technical leaders and product designers. What should I build next? How should I prioritise the features in the backlog?
We’re going to explore:
Impact vs Effort: quick and simple but inaccurate
ICE or RICE: more detailed but open to manipulation
Kano prioritisation: based on customer feedback (jump to this part)
Prioritising your backlog is about making sure the most valuable item is at the top and gets worked on next. That’s the ultimate goal. Ideally your backlog should always be roughly prioritised so you can quickly glance at what’s coming up.
Let’s explore a few ways to prioritise your list of features, starting with something simple and then move on to something more complex.
1. Impact vs Effort
Every item on your backlog will take some amount of effort to complete. And each item will deliver some amount of impact, or value. If you could quantify these two things, you could work on the highest impact, and lowest effort items.
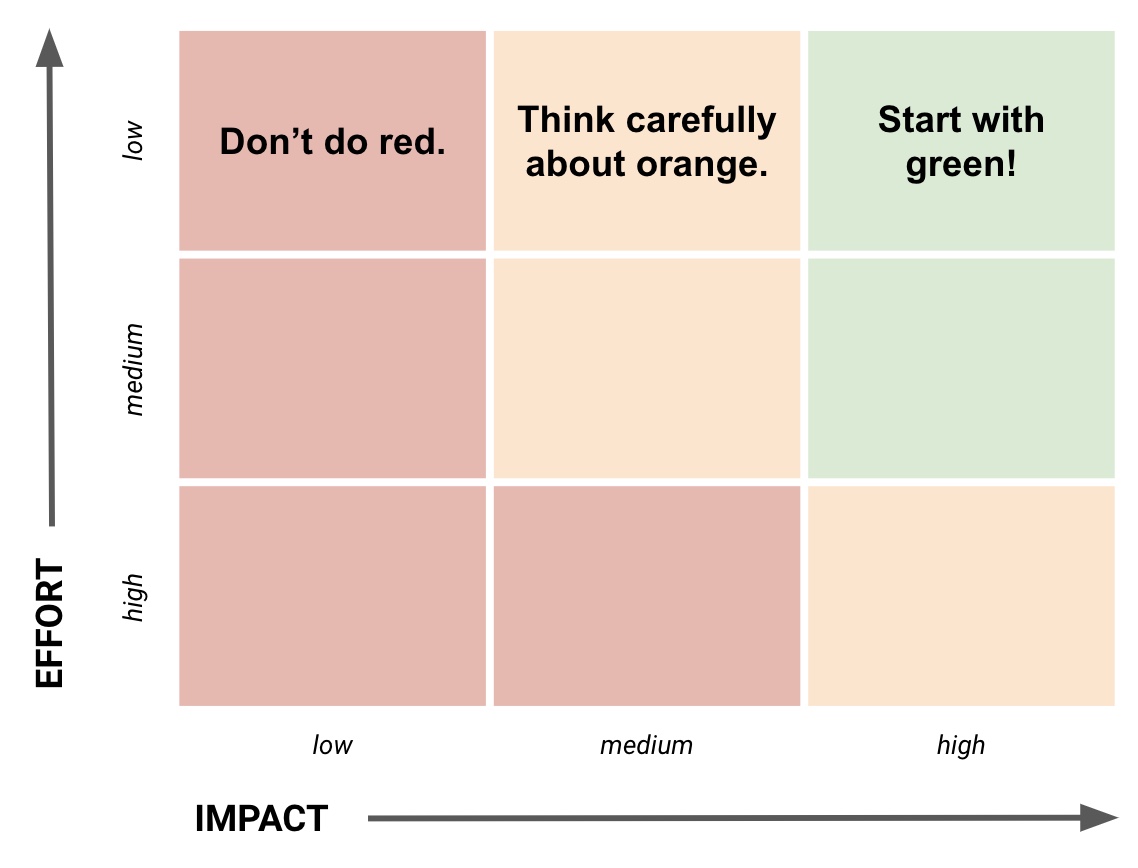
For each item, estimate the effort to get it live. This could be design & engineering effort, sales or marketing, or legal, or whatever it takes to make it happen. Then estimate the impact you’ll see once it’s live. Impact can be thought about as revenue, or improvement in customer experience, or whatever you’re looking for. To keep things comparable though, estimate on a general scale of just “High” and “Low”. If you want more granularity you could use a t-shirt size scale: XS, S, M, L, XL.
Once you’ve estimated the backlog items you can plot them on a 2 dimensional graph, with effort on one axis and impact on the other. You can see in the diagram that the items in the top right quadrant are the highest impact and lowest effort - start with these! Then work your way up the effort axis, always focusing on backlog items that have high impact.
2. ICE or RICE
These two prioritisation models are very similar and operate in the same way. Essentially the idea is to gather a bunch of data about each backlog item, and then combine it with a formula to produce a prioritisation score. Then you sort your backlog by the score to see the prioritisation.
ICE is simpler and doesn’t need as much insight into an existing product. ICE stands for:
Impact: this could be measured in terms of revenue, or a 1-10 scale for impact on customer experience. Maybe if Net Promoter Score (NPS) is a key metric for you, you could estimate the increase you’d get in your NPS score and use that as your Impact value. You can find anything you like but it must be the same for all backlog items.
Confidence: use a percentage (%) to represent your confidence in whether the idea will deliver the impact. 100 for something you’re absolutely sure of, and 0 if you have absolutely no idea whether it will work!
Ease: a simple scale of 1-5 for how simple this will be to achieve. 5 means it will be super easy.
The formula for calculating the ICE prioritisation score is: I x C x E
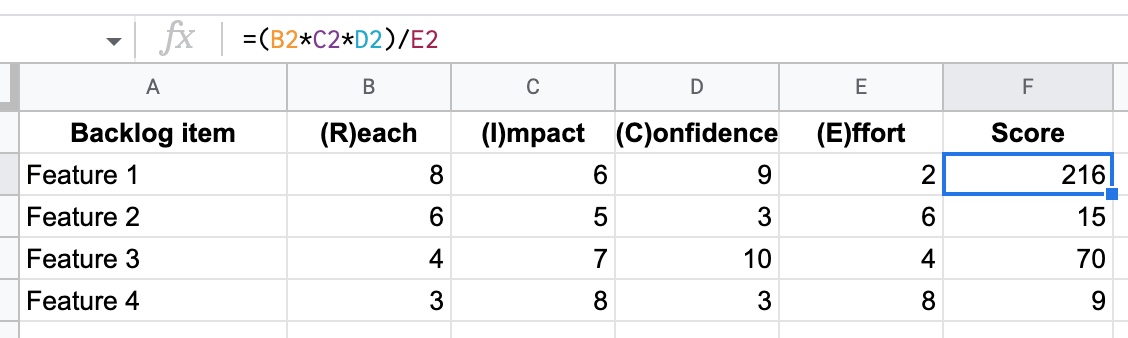
RICE adds an extra field to increase the accuracy of the scoring model:
Reach: how many people will feel the effect of the backlog item - this could be measured in pageviews or sessions, or number of users. Whatever you choose it must be the same across all backlog items.
Impact: same as ICE
Confidence: same as ICE
Effort: similar to ICE but this is the opposite, measuring how much effort has to go in rather than how easy something is. So think about the overall effort (design, engineering, marketing, etc) and give a high score where it will be a lot of effort. Use a 1-5 scale.
The formula for calculating the RICE scoring model is: (R x I x C) / E
You can extend either of these frameworks with your own criteria. Perhaps you want a column for “strategic alignment”, or “level of innovation”. You can add more in and update the formula to suit.
The risk to watch out for is twiddling the numbers until they say what you want them to. It’s easy to add another column or adjust the formula to create whatever prioritisation you want. So as a product manager you must think very carefully about the criteria and once you’ve committed try to stick to it.
3. Kano model prioritisation
Where the above prioritisation frameworks fall down is that they don’t take customer feedback and opinion into account. They’re almost entirely based on the view of the people inside the company who are working on the product.
Online Kano Model is a different and complementary way of prioritising your feature backlog that can be used to replace or augment one of the other approaches.
Kano model prioritisation works by asking certain questions to your customers or users of your product. For each of the features you’re interested in prioritising, you ask how they’d feel about having the feature and not having the feature. The results of the survey are processed and each feature is categorised:
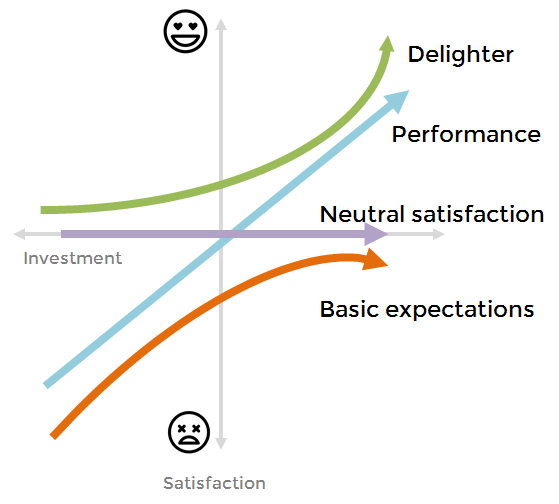
Delighter: users love these features, but don’t mind if they’re absent
Performance: the better the feature is implemented, the most users like it
Must-have: the product is not complete without these features
Reverse: these features will spoil the product
Indifferent: users don’t care if the feature is present or not
As you can see the Kano prioritisation categories are incredibly powerful to help you sequence your backlog. You know exactly where to focus based on what your customers want, rather than what you’re guessing about things like reach and impact.
How should I respond to the difference categories?
Must-haves: these are pretty simple - you must have them! These are things that will block your customers from using your product. However it's probably a little more nuanced than that - some must-haves will only apply to certain segments of your audience rather than everyone.
Generally you should build as many of these as is suitable for your segment of the market, to a reasonable degree of performance - if you can find a more lightweight way of achieving the same outcome for users, or some sort of workaround you can explore those too.
Performance: the value of these should correlate with the quality of the execution of the feature. This means you'll need a way of measuring how well your version of the feature is being received by users. This could be usage metrics, repeat usage / retention metrics or separate qualitative surveys like Customer Satisfaction (CSAT).
If your product has no performance features, it will appear to users as a 'barebones' tool, a basic and simple thing that should probably be cheap. Performance features are where users can see the value in what they're paying for.
Delighters: these are the icing on the cake. They can trigger "wow" moments in your users that can drive conversions and word of mouth referrals. These should give you an insight into the things that are not required for your product to be useful, but this is what your market really enjoys. Some of these things will be simple and cheap to implement, some will be a serious investment. Your investment in delighters will be partly driven by your marketing strategy, and your brand's tone of voice.
Indifferent: you can ignore these. Users don't care if you have these features or not. For some reason users are not seeing the value in these features. They probably don't solve any core problems.
Reverse: you should tread carefully with reverse features. If you add them some people will explicitly dislike them and it may spoil the overall perception of your product. Generally this applies to how a particular feature is implemented vs the actual user outcome that it achieves. However there might be some features that are too separate from the core purpose of the product and it gives users the wrong impression, or makes them worry about the future direction of the product.
The final consideration is that it may not be all users that dislike a feature, it might just be a particular segment that is used to something different.
Unknown: this is where the answers don't make sense and so all we can really get from this category is that the feature needs further refinement so that users really understand the proposition and the value.
What should I actually build?
Don't just build only the Must-haves, or your product won't be very exciting.
Similarly, don't just build only the Delighters or your product won't meet your customers' basic expectations. Delight is only possible after the product has done what the user expects it to (which is usually what they're paying for!).
You can safely ignore Unknown, Indifferent and Reverse features, which leaves Must-haves, Performance and Delighters.
Start with the Must-haves. You've got to have a decent selection that meets the core needs for a particular segment of your market. It could be a small segment, so the list of must-haves could be very short. That's fine. You can always expand it later. Lean / Agile product develop suggests starting small and validating before you expand to include more functionality. Choosing these features might be simple because you've already got your market positioning sorted, or this could be how you decide on where you're going to play in the market and who your competitors will be.
Next is performance and delighter features. These things drive the differentiation from your competitors. They convey your brand and underpin the value in the product. Almost all differentiation falls along three broad axes: cheaper, faster, or better (and you usually can't have more than two at the same time!). Look at your competitors (as defined by your must-haves), and look at where they are weak and you can be strong.
Performance features underpin the value in the product. This is the "faster", "better" part of differentiation. Think of these as variable must-haves: if they're not there, that's the same as being there but being very low quality - users will be unhappy. You may want to raise the level of performance to meet your competitors, or exceed them (to steal customers or charge a higher price), or even beneath your competitors as part of a cheaper pricing strategy.
Delighter features make the product fun to use, memorable and shareable. Almost by definition your competitors won't have these - if they do then the features are slipping into 'must-have' territory. Use these as opportunities for retention and growth. If your brand is playful and not serious you can go all out.
TL;DR:
Build enough must-haves to meet the needs of your target market
Build performance features to the level that justifies your price
Build delighters to convey your brand and differentiate from competitors
The choice of which features to include is ultimately about balancing your investment, the type of product you want to build and how you want to position it in the market.
Read more about how to use a Kano survey to make a minimum viable product.
Advanced Kano analysis also offers insight into how much each feature is likely to affect overall customer satisfaction (or dissatisfaction) with your product.
Using the Kano Model in product management
When is Kano useful?
1. Generally, Kano prioritisation is useful before you build loads of stuff. For example, when you're in the scoping phase of a Minimum Viable Product, or maybe a major overhaul of your product that will have significant changes, or maybe a large feature with sub-components that you could treat independently.
Kano is a way of assessing the potential features and understanding how users will perceive them - this helps you decide what to include and what to leave out. It goes hand in hand with other prioritisation techniques that help with sequencing.
You want to make sure you're covering the basics (ie not leaving anyone disappointed because the essentials are lacking), while also giving people something to get excited about.
2. If you're already got a product that's OK too! You can run a Kano survey now to test your current featureset and understand your current balance. You will be able to see which category of features you're missing out on, and which ones you're over-indexing on.
You can repeat these surveys over time to see how attitudes and perceptions drift over time. What was once a Delighter will one day be a Must-have.
3. You can also run a survey about features that competitors have so you can see how they're appealing to your market. Perhaps they have a feature that you've always ignored but it turns out to be a Must-have: that's hugely valuable insight to have.
That's a wrap for Kano model prioritisation!
The Kano questionnaire format is pretty easy, but it can be time consuming to conduct the analysis. Learn with our Kano model categories diagram, and try our Kano analysis tool for free.